The conversation around website uptime monitoring has been frozen in place for nearly two decades. The dominant paradigm — ping a server every 60 seconds, send an alert if three consecutive pings fail, wake up an on-call engineer at 3 AM — has barely evolved since the era when Nagios was cutting-edge and the iPhone did not exist. That paradigm is not wrong, but it is reactive in a way that guarantees you discover problems only after they have already begun affecting users. A traditional ping-based monitor tells you that your website is down right now, at this moment, and the alert it fires arrives in your inbox while your customers are already staring at error pages, refreshing their browsers, and beginning the mental calculus of whether your service is reliable enough to trust with their business. The fundamental limitation of reactive monitoring is not the monitoring tool itself but the physics of the situation: an alert triggered by a failure can only arrive after the failure has occurred, and every second between failure and remediation is a second during which your reputation, revenue, and search rankings are bleeding away. The emergence of AI uptime monitoring predictive systems represents the first genuine paradigm shift in uptime monitoring since the invention of the ping check — a shift from detecting failures after they happen to predicting them before they manifest, from reacting to symptoms to identifying the underlying patterns that precede outages, and from manual remediation workflows to automated responses that can restore service before a single user notices degradation. At HostingCaptain, we have been tracking the evolution of AI-powered monitoring across the hosting infrastructure we manage and the provider ecosystems we evaluate, and the consistent pattern is that organizations adopting predictive monitoring are achieving uptime outcomes that reactive monitoring alone cannot deliver — not because they are responding faster to alerts, but because they are preventing the conditions that generate alerts in the first place.
The stakes of getting uptime monitoring right have escalated in parallel with the internet's integration into every dimension of economic and social life. An e-commerce store that goes offline during a holiday shopping weekend loses not just the revenue from transactions that fail to complete but the lifetime value of customers who, after encountering an error page, take their business to a competitor and never return. A SaaS platform whose API endpoints become unavailable for 45 minutes during a customer's critical business operation risks triggering the service credit clauses in its enterprise contracts and losing renewals when the annual contract review arrives. A news publisher whose site slows to a crawl during a major breaking-news event loses the audience surge that represents the single largest traffic opportunity of the quarter. In each of these scenarios, a reactive monitoring alert — "your site is down" — arrives too late to prevent the damage. Predictive AI monitoring, by contrast, detects the conditions that precede these failures — the gradual memory leak that will exhaust available RAM in 90 minutes, the disk I/O saturation pattern that preceded the last three database crashes, the anomalous spike in database connection pool usage that correlates with the application server becoming unresponsive — and surfaces them while there is still time to intervene. This article examines how ai uptime monitoring predictive technology actually works, how it differs from traditional ping-based approaches, what benefits it delivers in production environments, and how hosting customers and providers alike can integrate it into their infrastructure. For readers building foundational knowledge of the AI infrastructure that powers these monitoring systems, our comprehensive guide to AI hosting covers the GPU architectures and machine learning pipelines that make predictive analytics computationally feasible at the scale modern hosting environments require.
The Limits of Traditional Ping-Based Monitoring
Traditional uptime monitoring operates on a model that is conceptually simple and operationally well understood: a monitoring agent, located on infrastructure external to the server being monitored, sends a request — typically an ICMP ping, an HTTP GET to a known URL, or a TCP connection attempt to a specific port — at a fixed interval, most commonly every 30 to 60 seconds. If the request succeeds within a configured timeout threshold, the server is considered up. If the request fails — no response, a TCP connection refused, an HTTP status code in the 5xx range — the failure is logged, and if a configurable number of consecutive failures accumulate (typically three), an alert is dispatched via email, SMS, push notification, or integration with incident management platforms like PagerDuty and Opsgenie. This model has been the backbone of uptime monitoring since the commercial internet's earliest days, and it remains the default configuration for the overwhelming majority of websites and web applications monitored by services like Pingdom, UptimeRobot, StatusCake, and the monitoring modules bundled with hosting control panels. It works. It catches failures. It has prevented uncountable hours of undetected downtime. But it has structural limitations that become increasingly consequential as websites transition from static brochures to revenue-critical transactional platforms.
The first limitation is temporal resolution. A monitor that checks your server every 60 seconds has a minimum detection latency of 60 seconds and a worst-case detection latency approaching 120 seconds — the monitor checks, your server fails one second later, and 59 seconds pass before the next check detects the failure. In a world where Google's Core Web Vitals measure user experience in milliseconds, a one-to-two-minute detection gap is an eternity during which users are encountering errors without the operations team knowing anything is wrong. Compounding this, the three-failure threshold that most monitoring services recommend to filter out transient network hiccups extends the minimum alerting latency to three to four minutes from the onset of a genuine outage. For a high-traffic e-commerce site generating $10,000 per hour in revenue, a four-minute detection lag translates to roughly $667 in revenue lost before anyone is even aware of the problem — and that is before accounting for the additional minutes or tens of minutes required for a human operator to acknowledge the alert, diagnose the issue, and execute a remediation. The total mean time to resolution (MTTR) for a traditional monitoring workflow — detection latency plus human response time plus diagnostic time plus remediation time — routinely exceeds 15 to 30 minutes, a window during which the business is hemorrhaging revenue, reputation, and customer goodwill.
The second limitation is that ping-based monitoring is intrinsically reactive: it can only tell you that a failure has already occurred, never that a failure is likely to occur soon. A server whose memory utilization has been climbing steadily for six hours, whose disk I/O latency has increased 400% in the past 90 minutes, and whose database connection pool is approaching exhaustion at a rate that projects failure within the next hour will pass every ping check with flying colors — right up until the moment it doesn't. Traditional monitoring sees none of these precursor signals because it is not designed to look for them. It asks a binary question — is the server responding right now? — and receives a binary answer. The rich telemetry data that modern servers generate — CPU utilization curves, memory pressure statistics, disk I/O patterns, network throughput trends, application-level error rates, database query latency distributions — sits in separate monitoring systems (infrastructure monitoring, application performance monitoring, log aggregation) that are not integrated with the uptime monitoring layer, and the correlations between these telemetry streams that could predict an impending outage are invisible to the operations team until the outage actually occurs. This siloing of monitoring data is the single largest reason that organizations experience "unexpected" outages — the data that would have made the outage predictable existed but was not being analyzed in a way that surfaced the warning signs. The W3C web standards community has begun documenting the requirements for integrated monitoring architectures, though practical implementations currently outpace formal standardization efforts.
The third limitation is alert fatigue, which is both an operational problem and a reliability problem. Traditional monitoring systems, configured conservatively to avoid missing genuine failures, generate a high volume of false-positive alerts — transient network blips that resolve before the three-failure threshold is reached, planned maintenance windows that were not properly silenced, performance degradations that slow response times without triggering outright failures, and external dependencies (CDN providers, DNS services, third-party API endpoints) whose intermittent issues manifest as monitoring alerts even though the monitored server itself is healthy. Over time, operations teams subjected to a high ratio of false alarms to genuine incidents become desensitized to alerts — they begin to dismiss notifications without investigation, delay response because "it's probably nothing," and ultimately treat the monitoring system as background noise rather than as an actionable signal. This desensitization, documented extensively in human-factors research on alarm systems in aviation, nuclear power, and healthcare, is perversely dangerous: it means that the monitoring system most likely to generate a response to a genuine incident is not the one configured to be most sensitive, but the one configured to generate the fewest total alerts, because every false alarm erodes the credibility of the entire alerting system. Traditional ping-based monitoring, by generating alerts based on a single binary signal with no contextual filtering, is structurally prone to high false-positive rates, and the operational response to that problem — raising thresholds, increasing failure counts, extending check intervals — directly reduces the monitoring system's ability to detect genuine failures quickly. This is a trade-off with no good equilibrium: traditional monitoring either generates too many alerts and drives alert fatigue, or generates too few alerts and misses genuine incidents.
How AI-Powered Uptime Monitoring Works
AI uptime monitoring predictive systems replace the binary, threshold-driven logic of traditional monitoring with a multi-signal, pattern-driven approach that analyzes the full spectrum of server telemetry to identify the precursors of failure before the failure manifests. The architectural difference is fundamental: where traditional monitoring asks "is the server responding right now?", AI-powered monitoring asks "given the server's current state across all available telemetry dimensions, and the patterns observed in historical data from this server and from thousands of similar servers, what is the probability that this server will become unresponsive within the next 15 minutes, 30 minutes, or 60 minutes?" This reframing from detection to prediction is what makes AI monitoring a different category of tool rather than an incremental improvement on the traditional approach. It is the difference between a smoke detector that alerts you when your house is already on fire and a system that notices the unusual electrical current draw, the elevated temperature in a specific circuit, and the pattern of voltage fluctuation that preceded the last 10,000 electrical fires in similar installations — and alerts you before the fire starts.
The core technical mechanism is anomaly detection applied to time-series telemetry data. Every server generates continuous streams of numerical data: CPU utilization percentage sampled every second, memory consumption in gigabytes, disk I/O operations per second and latency in milliseconds, network packets per second and throughput in megabits, application request rates and response latency percentiles, database queries per second and query execution time distributions, and dozens more. An AI monitoring system ingests all of these streams simultaneously, builds a statistical model of what "normal" looks like for each metric — accounting for diurnal patterns (traffic peaks during business hours), weekly patterns (lower traffic on weekends), and seasonal patterns (holiday shopping spikes, end-of-month billing cycles) — and flags deviations from the expected range that are statistically significant. The key advance over traditional threshold-based alerting is that AI anomaly detection adapts to each server's specific operational profile rather than applying a single fixed threshold. A server that consistently runs at 80% CPU utilization during business hours is not anomalous when it hits 82%; a server that has run at 5% CPU utilization for six months and suddenly spikes to 45% is anomalous even though 45% is well below the 90% threshold that a traditional monitoring system might use. The AI model learns what is normal for each specific server and detects deviations from that server-specific baseline.
Pattern recognition — the second core mechanism — extends anomaly detection from individual metrics to relationships between metrics. A single anomalous metric may or may not be significant; the combination of several metrics moving in a correlated pattern that has historically preceded failures is a much stronger predictive signal. An AI monitoring system trained on outage data from thousands of servers can recognize that the pattern of "memory utilization climbing at X percent per hour while disk I/O latency increases and the rate of database connection timeouts rises" preceded a server crash in 87% of historical cases where that pattern was observed, and can generate a predictive alert when it detects that pattern forming — even though every individual metric in the pattern is still within its "normal" range. This multi-signal pattern recognition is what distinguishes predictive AI monitoring from simple anomaly alerting: it is not just flagging that something unusual is happening, but flagging that the specific combination of unusual things happening is the combination that has historically led to failure. The machine learning models that power this recognition — typically long short-term memory (LSTM) networks, temporal convolutional networks, or transformer-based time-series models — are trained on labeled historical data that pairs telemetry time-series with known outcomes (server crashed at timestamp T, server remained healthy through the observed window) and learn to identify the precursor patterns that distinguish the pre-failure sequences from the benign anomaly sequences.
The third mechanism — predictive analytics proper — projects current telemetry trends forward to estimate when, if current trajectories continue, specific resources will be exhausted. This is the most straightforward of the three mechanisms conceptually but often the most immediately actionable: if available memory is declining at 200 MB per hour and 1.2 GB remains, the system projects memory exhaustion in approximately six hours and generates an alert with that time horizon. If database disk space is being consumed at 3 GB per day and 18 GB remains, the system projects exhaustion in six days. These projections, unlike traditional threshold alerts that fire at a fixed percentage (alert when disk is 90% full), provide operations teams with a time-to-impact estimate that allows them to plan and execute remediation during business hours rather than responding to a crisis at 3 AM. The predictive analytics layer also accounts for trend acceleration or deceleration — a memory leak that is accelerating will exhaust available memory sooner than a linear extrapolation would suggest — by fitting curves to the consumption data rather than assuming constant-rate depletion. For readers interested in the broader infrastructure context that makes this level of telemetry analysis possible, our analysis of AI hosting vs traditional hosting examines the hardware and software architectures that support production-scale machine learning workloads.
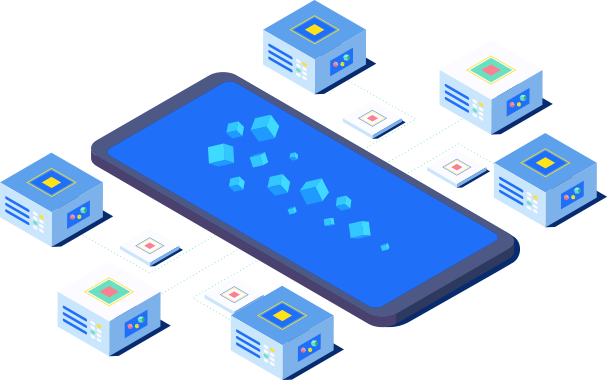
Illustration: AI-Powered Uptime Monitoring: How Predictive Alerts WorkThe Core Benefits: Prediction, Precision, and Automation
The operational benefits of ai uptime monitoring predictive systems cluster around three capabilities that traditional monitoring cannot deliver: predicting failures before they impact users, reducing false alarms through contextual signal processing, and enabling automated remediation that resolves issues without human intervention. Each of these capabilities addresses a specific failure mode of the traditional monitoring model, and together they represent a step-change improvement in the uptime outcomes that hosting operations can achieve with the same or smaller operations teams.
The most transformative benefit is the shift from reactive to predictive alerting — the ability to detect conditions that will lead to failure before the failure occurs. A predictive alert that fires 45 minutes before a projected server crash gives the operations team 45 minutes to investigate, diagnose, and remediate — a fundamentally different operational experience from receiving an alert that the server is already down and every passing second is costing revenue. In practice, predictive alerts enable a set of operational workflows that are impossible with reactive monitoring: scheduling a maintenance window to address a memory leak during a low-traffic period rather than scrambling to restart the server during peak business hours; migrating traffic away from a server that is showing early signs of hardware degradation before the degradation progresses to failure; scaling up database capacity in response to storage consumption trends rather than scrambling to free space after the database has already stopped accepting writes. These workflows convert what would have been incidents — events that disrupt service and require urgent response — into planned maintenance tasks that can be executed methodically, during business hours, by the right team members, with minimal or zero user impact. The impact on mean time to resolution is dramatic not because remediation is faster but because remediation happens before the outage begins, making the MTTR for predictive-detected issues effectively negative — the issue is resolved before any downtime occurs.
The second benefit — false alarm reduction — addresses the alert fatigue problem that plagues traditional monitoring. AI monitoring systems reduce false alarms through two mechanisms: contextual filtering and multi-signal correlation. Contextual filtering means that the system understands the difference between a genuine anomaly and an expected deviation — a server that spikes to 100% CPU utilization for 30 seconds during a cron job that runs every hour at :00 is not generating a failure risk, and the AI system, having learned this pattern from historical data, does not generate an alert for it, whereas a traditional threshold-based monitor configured to alert at 95% CPU would fire every hour. Multi-signal correlation means that a single anomalous metric does not trigger an alert unless it is part of a pattern that includes multiple correlated anomalies or that matches a known pre-failure signature. A transient network packet loss that lasts 15 seconds and resolves without any correlated degradation in application response times or error rates is filtered out; the same packet loss coinciding with rising application error rates and database connection failures is escalated. The result is a dramatically higher signal-to-noise ratio: operations teams receiving AI-generated alerts are responding to a stream of high-probability genuine issues rather than wading through a firehose of threshold violations, and the credibility of the alerting system is preserved because every alert represents a situation that genuinely requires attention.
The third benefit — automated remediation — is the logical endpoint of predictive monitoring: if the system can predict a failure and identify the likely cause well enough to recommend a remediation action, it can also execute that action automatically. AI-powered auto-remediation systems integrate with infrastructure management APIs to perform predefined corrective actions when specific predictive patterns are detected: automatically restarting a service that is exhibiting the memory leak pattern associated with that specific service version, scaling up a database instance when storage consumption trends indicate exhaustion within the forecast window, failing over to a standby replica when the primary shows precursor signals of hardware degradation, or provisioning additional application server instances when traffic pattern analysis predicts a demand surge that will exceed current capacity. The critical design principle is that automated remediation actions should be restricted to patterns with very high prediction confidence and to actions whose consequences are well understood — automatically restarting a service during a low-traffic window when the AI model has 95% confidence that the service will crash within the hour is a reasonable automation; automatically rebooting a database primary based on a 60% confidence prediction is not. The most sophisticated AI monitoring deployments use a tiered automation model: low-risk, high-confidence predictions trigger fully automated remediation; medium-confidence predictions generate alerts with recommended actions that a human operator can approve with a single click; and low-confidence but high-impact predictions generate standard alerts for human investigation. This tiered approach captures the efficiency gains of automation while maintaining human oversight over actions whose consequences could be severe if the prediction is wrong. For organizations evaluating the infrastructure that supports automated remediation at scale, our complete beginner's guide to VPS hosting provides foundational context on the virtualization and API layers that make programmatic infrastructure control possible.
Top AI Monitoring Tools and Platforms in 2026
The AI monitoring landscape in 2026 has matured from experimental startups and research projects into a competitive market of production-grade platforms, each with distinct architectural approaches, integration footprints, and pricing models. Understanding the landscape requires distinguishing between three categories of AI monitoring tools: purpose-built AI observability platforms that have AI/ML at their architectural core, established monitoring platforms that have added AI-powered features to their existing product suites, and open-source frameworks that allow organizations to build custom AI monitoring on their own infrastructure.
Datadog Watchdog is the most widely deployed AI monitoring capability in the hosting and cloud operations market, benefiting from Datadog's massive telemetry ingestion footprint across hundreds of thousands of customer environments. Watchdog applies machine learning to the full Datadog telemetry corpus — infrastructure metrics, APM traces, log data, real user monitoring (RUM) data, and synthetic monitoring checks — to detect anomalies, correlate signals across data sources, and surface predictive insights. Its strength is breadth: because Datadog ingests telemetry from every layer of the stack, Watchdog can correlate an application latency spike with a database connection pool exhaustion with a Kubernetes node memory pressure condition, identifying the root cause cascade that traditional single-signal monitoring would miss. Pricing scales with infrastructure size, making Watchdog cost-effective for mid-market and enterprise hosting deployments but potentially expensive for smaller environments. New Relic AI offers comparable capabilities with a particular strength in application performance monitoring integrations, applying anomaly detection and predictive analytics to the APM telemetry that New Relic has specialized in throughout its product history.
Dynatrace Davis is notable for its deterministic AI engine — Davis uses a topological model of the monitored environment rather than purely statistical anomaly detection, mapping the dependency relationships between every component (hosts, processes, services, network connections) and using that map to perform precise root cause analysis when anomalies are detected. When a server begins exhibiting degraded performance, Davis traces the degradation through the dependency graph to identify which specific component is the root cause and which downstream components are suffering secondary effects — a capability that purely statistical anomaly detectors struggle to match. Davis's deterministic approach also means it does not require the extended training period that statistical models need to establish baselines; it can begin generating useful insights shortly after deployment. ServiceNow ITOM AIOps integrates AI monitoring into the ServiceNow IT operations management platform, with the particular advantage of tight integration with incident management workflows: when Davis-equivalent AI detects a predictive issue, ServiceNow can automatically create an incident record, route it to the appropriate team based on the predicted root cause, and populate it with the relevant telemetry context — closing the loop between detection and response in a way that standalone monitoring tools require custom integration to achieve.
Grafana Loki with ML extensions and Prometheus with predictive alerting rules represent the open-source path to AI monitoring, though they require substantially more engineering investment to configure and maintain than commercial platforms. The open-source approach typically involves deploying Prometheus for metrics collection, Loki for log aggregation, and a machine learning layer — often a Python-based time-series anomaly detection library like Facebook's Prophet, LinkedIn's Luminol, or a custom TensorFlow/PyTorch model — that consumes Prometheus metrics and generates predictions. This approach provides maximum customization and avoids vendor lock-in, but it requires the organization to have machine learning engineering capability in-house — a constraint that makes it practical primarily for larger hosting companies and enterprises with dedicated infrastructure engineering teams. For organizations evaluating the infrastructure that would support an open-source AI monitoring deployment, our analysis of LLM-powered search and hosting SEO provides context on how AI infrastructure investments compound across operational domains.
HostingCaptain AI Monitoring — our integrated monitoring platform purpose-built for hosting environments — applies predictive analytics and anomaly detection specifically to the telemetry patterns that characterize web hosting workloads: web server request rates and error percentages, PHP-FPM process pool exhaustion patterns, MySQL/MariaDB query throughput and slow query accumulation, disk I/O saturation on shared storage systems, and bandwidth utilization trajectories. The platform is designed to monitor hosting infrastructure across shared, VPS, dedicated, and cloud environments with pre-built integrations for cPanel, Plesk, and DirectAdmin control panels, and with predictive models trained specifically on hosting workload telemetry rather than on general-purpose server data. For HostingCaptain customers, the monitoring platform is integrated directly with our support operations, meaning that predictive alerts can automatically create support tickets and trigger remediation workflows before the customer is even aware of an emerging issue — a capability that fundamentally changes the support experience from "customer reports a problem" to "HostingCaptain detects and resolves the problem before the customer notices."
Integrating AI Monitoring with Your Hosting Infrastructure
Integrating ai uptime monitoring predictive into an existing hosting infrastructure is a phased process that rewards incremental adoption over big-bang deployment. The technical integration path depends on the monitoring tool selected, the hosting environment's architecture (shared, VPS, dedicated, cloud, or hybrid), and the organization's operational maturity. However, the integration playbook follows a consistent pattern across environments: instrument, ingest, baseline, and activate — four phases that progressively build the telemetry foundation and AI model training required for predictive capabilities to function reliably.
The instrument phase involves deploying monitoring agents or enabling API-based telemetry collection across every server, container, and service that constitutes the hosting environment. For Linux servers — the dominant platform in web hosting — this typically means installing a monitoring agent (the Datadog agent, New Relic infrastructure agent, Dynatrace OneAgent, or Prometheus node_exporter) that collects CPU, memory, disk, and network metrics from the operating system kernel. The agent should be configured to collect at a granularity of 15 to 30 seconds — finer than the 60-second default that most monitoring agents ship with, because AI models benefit from higher-resolution data for detecting short-duration precursor patterns. For application-layer visibility, APM agents should be deployed to instrument web server processes (Apache, Nginx, LiteSpeed), PHP-FPM pools, database servers (MySQL, MariaDB, PostgreSQL), and caching layers (Redis, Memcached) — capturing request rates, error rates, response latency distributions, and resource pool utilization at the application level. For containerized hosting environments running on Kubernetes or Docker, the monitoring deployment should include cluster-level metrics (node health, pod scheduling, resource requests vs. limits) in addition to the per-container telemetry that maps to the traditional server-level metrics. The principle is comprehensive instrumentation: AI predictive models are only as good as the data they are trained on, and gaps in telemetry coverage create blind spots where failures can develop undetected.
The ingest phase involves routing the collected telemetry to the AI monitoring platform's data pipeline. For commercial platforms like Datadog, New Relic, and Dynatrace, this is handled automatically by the vendor's agent and cloud ingestion endpoint — the agent collects and forwards, and the platform handles storage, indexing, and analysis. For open-source deployments built on Prometheus and Loki, the ingest architecture requires deploying and scaling the Prometheus server (or Thanos/Cortex for horizontal scalability), configuring retention policies that preserve enough historical data for the AI model to establish meaningful baselines (at least 30 days, ideally 90 days for capturing weekly and monthly seasonal patterns), and ensuring that the telemetry pipeline has sufficient capacity and reliability that data gaps do not degrade the AI model's training quality. The ingest phase also includes configuring data transformation and enrichment — normalizing metric names across heterogeneous server fleets, tagging telemetry with metadata (environment, service, team, customer) that enables the AI model to group servers into cohorts for comparative anomaly detection, and filtering out known-bad data (monitoring agent crashes, network interruptions during data transmission) that would inject noise into the training dataset.
The baseline phase — the most time-consuming and patience-requiring step — involves allowing the AI monitoring system to observe the hosting environment under normal operation for a sufficient period to establish statistical baselines for every metric on every server. For most commercial AI monitoring platforms, the baseline period is two to four weeks: the system observes diurnal cycles (weekday traffic patterns vs. weekend patterns), weekly cycles (lower weekend traffic, Monday morning spikes), and any monthly patterns (end-of-month billing or reporting activity that generates higher load), and builds the statistical models that define the "normal" operating envelope for each metric on each server. During this phase, the AI system may generate false-positive anomalies as it encounters legitimate but previously unobserved patterns — the system does not yet know that the batch processing job that runs on the first of every month is expected behavior — and operations teams should provide feedback (marking anomalies as "expected" or "not an incident") to accelerate the model's learning. The baseline phase is also when organizations should calibrate the sensitivity of the AI system's anomaly detection: too sensitive, and the system will generate excessive alerts during the initial deployment; too insensitive, and it will miss genuine precursors. Most platforms start with a moderate sensitivity and adjust based on feedback during the baseline period.
The activate phase — enabling predictive alerts and automated remediation — should begin only after the baseline phase has produced stable, low-false-positive anomaly detection. At this point, the AI system has learned what normal looks like, has been trained on enough historical data to recognize the precursor patterns that precede failures, and can begin generating predictive alerts with acceptable accuracy. Organizations should activate predictive alerts in a phased manner: start with the lowest-risk, highest-confidence predictions (resource exhaustion projections, which are straightforward trend extrapolations rather than complex pattern recognition), expand to anomaly-based predictions as confidence in the baseline models grows, and activate automated remediation only for prediction categories that have demonstrated high accuracy over a sustained period of production operation. The activate phase should also include configuring the integration between the AI monitoring system and the incident management and notification platforms that the operations team uses — ensuring that predictive alerts flow into the same PagerDuty escalation policies, Slack channels, and ticketing systems that traditional alerts use, rather than creating a parallel alert stream that the team must monitor separately. The integration with existing workflows is what determines whether the AI monitoring system becomes part of the team's operational DNA or remains an expensive dashboard that nobody checks during an incident.
Cost Comparison: AI Monitoring vs Traditional Monitoring
The cost comparison between ai uptime monitoring predictive and traditional ping-based monitoring is not a simple feature-for-feature price comparison because the two categories deliver fundamentally different capabilities. A direct price comparison — this traditional monitoring service costs $15 per month while this AI monitoring platform costs $150 per month — is misleading because it compares a tool that tells you when your site is down to a tool that tells you before your site goes down, and the value of avoiding an hour of downtime for a revenue-generating website can exceed the annual cost of either monitoring solution. The relevant comparison is total cost of ownership (TCO) inclusive of the cost of downtime that each monitoring approach prevents, not the subscription price of the monitoring tool in isolation.
Traditional uptime monitoring services — Pingdom, UptimeRobot, StatusCake, HetrixTools — are priced based on the number of monitors (individual URLs or servers being checked), the check frequency (1-minute, 5-minute, or 15-minute intervals), and the number of alert contacts or notification channels. A basic plan with 10 to 50 monitors at 1-minute intervals typically costs $10 to $50 per month; an advanced plan with 100 to 500 monitors, transaction monitoring (multi-step user journey simulation), and public status pages ranges from $50 to $200 per month. At the enterprise tier, with thousands of monitors, global check locations, API access, and SLA reporting, costs range from $200 to $1,000 per month. These are predictable, fixed monthly costs that scale linearly with the number of monitored endpoints. The hidden cost — the downtime that the monitoring detects but does not prevent — is harder to quantify but is the dominant cost driver for any business where website availability directly generates revenue. An e-commerce site that experiences two hours of unplanned downtime per month at a revenue rate of $500 per hour loses $12,000 per year to downtime — a cost that dwarfs the monitoring subscription fee and that a predictive monitoring system could reduce by catching and resolving the precursor conditions before they escalate to outages.
AI-powered monitoring platforms are priced on fundamentally different models that reflect their data ingestion and computation requirements. Datadog's AI capabilities (Watchdog) are included in its infrastructure monitoring tier, which costs $15 per host per month — meaning a 10-server hosting environment would pay $150 per month for infrastructure monitoring with AI anomaly detection, scaling to $1,500 per month for a 100-server environment. New Relic's AI capabilities are included in its data ingestion-based pricing, where costs depend on the volume of telemetry data ingested per month — typically $0.30 to $0.50 per GB — translating to $300 to $1,000 per month for a typical mid-range hosting deployment ingesting 600 to 2,000 GB per month. Dynatrace's Davis AI is priced per host per month at $55 to $75 for full-stack monitoring, or $550 to $750 per month for a 10-server environment. For small hosting environments with 5 to 10 servers, AI monitoring platforms represent a meaningful cost increase over traditional ping-based monitoring — $150 to $750 per month versus $15 to $50 per month. But for any environment where a single hour of downtime costs more than the monthly monitoring subscription, the investment in predictive capability is financially rational even at the low end of the server count range, and the financial case strengthens as the environment scales.
The open-source path — Prometheus + Grafana + custom ML models — has near-zero software licensing cost but carries substantial engineering labor cost. Deploying, configuring, and maintaining a Prometheus monitoring stack with a machine learning layer for predictive analytics requires a dedicated infrastructure engineer allocating 25% to 50% of their time, representing $30,000 to $75,000 per year in fully loaded labor cost depending on the engineer's seniority and geographic market. For organizations that already employ infrastructure engineers with the requisite skills and that operate at a scale (50+ servers) where the labor cost amortizes to a reasonable per-server rate, the open-source path can be cost-competitive with commercial platforms. For smaller organizations, the labor cost of building and maintaining custom AI monitoring typically exceeds the subscription cost of a commercial platform, and the commercial platform additionally provides vendor support, continuous model improvement, and integration maintenance that the custom solution requires in-house effort to replicate. The HostingCaptain approach — AI monitoring integrated directly into our hosting platform at no additional per-server monitoring cost beyond the hosting plan itself — represents a distinct pricing model that eliminates the separate monitoring subscription entirely, making predictive monitoring accessible to hosting customers who would not independently purchase a commercial AI monitoring platform. For customers evaluating their overall hosting infrastructure costs, our analysis of what changes in AI hosting vs traditional hosting provides the cost structure context for AI-enabled infrastructure investments across the stack.
Setting Up AI-Powered Uptime Monitoring: A Practical Guide
Deploying ai uptime monitoring predictive in a hosting environment is a structured process that can be executed in two to four weeks for most small-to-mid-sized deployments using a commercial platform, or in four to eight weeks for a custom open-source deployment. The following guide assumes a hosting environment with 5 to 50 servers running Linux, a mix of web servers (Apache/Nginx), database servers (MySQL/PostgreSQL), and supporting services (Redis, Memcached), monitored through a commercial AI platform — the most common deployment scenario for HostingCaptain customers and for the broader small-to-mid-sized hosting market.
Week 1: Platform Selection and Initial Instrumentation. Evaluate AI monitoring platforms based on your hosting environment's specific characteristics: the operating systems and distributions in use (the monitoring agent must support them), the control panel ecosystem (cPanel, Plesk, DirectAdmin — some monitoring agents have pre-built integrations that simplify agent deployment across cPanel-managed servers), the scale of the environment (number of servers, volume of telemetry, budget), and the operational team's familiarity with the platform's interface and alerting model. Sign up for a trial account with the selected platform and deploy the monitoring agent to a representative subset of servers — three to five servers that cover the environment's workload diversity (a web server, a database server, a mixed-use server) — to validate that agent installation, telemetry collection, and dashboard rendering work as expected before rolling out to the full fleet. Configure the agent to collect at 15-second to 30-second granularity and verify that all expected metrics (CPU, memory, disk, network, per-process metrics) appear in the platform's dashboards.
Week 2: Full Deployment and Anomaly Detection Activation. Deploy the monitoring agent to all remaining servers. Configure metric tagging — environment (production/staging/development), service type (web/database/cache/queue), customer or application name — consistently across all servers to enable cohort-based anomaly detection and cost attribution. Activate the platform's anomaly detection capabilities, but keep alerting disabled during this week — the system should detect and log anomalies so the operations team can review them, but should not yet generate alerts that would reach the team's notification channels. This "silent running" week allows the platform's AI models to begin establishing baselines and allows the operations team to review the anomalies the system is detecting, identify obvious false positives (scheduled batch jobs, maintenance windows), and provide feedback that accelerates model training. Review the anomaly detection output daily with the operations team to build familiarity with the platform's anomaly presentation and to calibrate expectations about the types of anomalies the system detects.
Week 3: Alerting Configuration and Predictive Activation. Configure alerting rules that translate AI-detected anomalies and predictions into notifications routed to the operations team. Start conservatively: enable alerts only for high-severity anomalies (those that the platform's AI model assigns high confidence and high impact scores) and for resource exhaustion predictions with time horizons of less than 24 hours. Configure notification routing — which anomalies go to which team members through which channels (email for low-urgency predictions, Slack for medium-urgency, PagerDuty for high-urgency) — and test that notifications are delivered correctly. Activate predictive alerts for resource exhaustion (disk space, memory, database storage) and review the first wave of predictive alerts as a team to validate that the predictions are reasonable before expanding to more complex pattern-based predictions. During this week, the operations team should also configure maintenance windows and alert suppression rules for known-bad patterns (the batch job that runs every night at 2 AM and spikes CPU to 100% for five minutes) to reduce false-positive alerting before predictive alerts go fully live.
Week 4: Auto-Remediation Pilot and Optimization. Identify the single highest-confidence, lowest-risk automated remediation action that the AI monitoring platform can execute — for most hosting environments, this is automated restart of a web server process (Apache or Nginx) when the AI model predicts an imminent crash due to a recognized memory leak pattern, during a low-traffic window, for a specific server where the operations team has high confidence in the prediction accuracy. Configure the automated remediation workflow: the AI platform detects the pattern, generates a prediction, validates that the confidence score exceeds the automation threshold, checks that the current time is within the approved automation window, and executes the restart via the infrastructure management API — all within a workflow that logs every action for audit and that can be disabled with a single configuration change if the automation proves unreliable. Monitor the automated remediation pilot closely during this week, reviewing every automated action to confirm that it was appropriate and that it resolved the predicted issue. Based on the pilot results, expand automated remediation to additional server types and prediction categories in subsequent weeks, always maintaining the tiered model where lower-confidence predictions generate alerts for human review rather than automated action.
Ongoing: Continuous Improvement. AI monitoring is not a deploy-and-forget system; it requires ongoing attention to maintain and improve prediction accuracy as the hosting environment evolves. Review the AI monitoring platform's performance monthly: false positive rate (alerts that did not correspond to actual or impending issues), false negative rate (issues that occurred without generating a predictive alert), mean time to detect for issues that did generate alerts, and correlation between predictive alerts and actual incidents. Adjust anomaly detection sensitivity, alerting thresholds, and automation rules based on these reviews. As the hosting environment changes — new server types added, new applications deployed, traffic patterns shifted by business growth or seasonal effects — the AI models will adapt automatically to new baselines, but the operations team should verify that the adaptation is producing reasonable results and intervene manually (by providing feedback on specific anomalies) if the model appears to be slow to adapt. The continuous improvement cycle closes the loop between deployment and operations, ensuring that the AI monitoring investment compounds in value over time as the models become more accurate and the team's confidence in predictive alerts and automated remediation grows.
Frequently Asked Questions
How is AI-powered uptime monitoring different from setting up server resource alerts in cPanel or a traditional monitoring tool?
Traditional resource alerts — like cPanel's "disk usage at 90%" notification or a CPU threshold alert in a monitoring dashboard — fire when a single metric crosses a fixed threshold that an administrator configured manually. These alerts are static, single-signal, and uncalibrated to the specific server's normal operating patterns. A server that always runs at 15% CPU will trigger the same 90% alert at the same threshold as a server that always runs at 85% CPU, even though the former is dramatically more anomalous. AI-powered monitoring learns each server's individual baseline — what "normal" looks like for that specific server at that specific time of day and day of week — and flags deviations from that baseline regardless of whether they cross a fixed threshold. Additionally, AI monitoring correlates multiple signals: a memory leak that is not yet at a critical level but is rising in a pattern that matches historical pre-crash sequences will generate a predictive alert, whereas a traditional threshold-based system would remain silent until the memory was actually exhausted and the server crashed. The fundamental difference is that traditional alerts tell you what has already happened; AI predictive alerts tell you what is about to happen.
Do I need a dedicated GPU server to run AI uptime monitoring?
No. The AI models that power predictive monitoring — the anomaly detection algorithms, pattern recognition systems, and trend projection engines — run on the monitoring platform's infrastructure, not on your servers. The monitoring agent deployed on your servers is a lightweight data collector that consumes minimal CPU and memory (typically less than 2% CPU and 100-200 MB of RAM) and transmits telemetry to the platform's cloud-based AI engine for analysis. Your servers do not need GPUs, do not run machine learning training or inference workloads, and do not experience any performance degradation from the AI monitoring beyond the negligible overhead of the monitoring agent itself. The AI computation happens in the monitoring vendor's data centers (for commercial platforms) or on your dedicated monitoring infrastructure (for open-source deployments), completely decoupled from the servers being monitored. This architectural separation is intentional: the AI system that predicts failures must run on infrastructure independent of the servers it monitors, so that it continues operating even if the monitored servers are experiencing severe performance degradation.
How long does it take for AI monitoring to become accurate enough to trust?
For resource exhaustion predictions — projecting when disk space, memory, or database storage will be depleted based on current consumption trends — useful predictions are available within hours of deployment, because trend extrapolation does not require historical baselines or pattern learning. For anomaly detection — flagging when a metric deviates from its normal range — the system typically requires one to two weeks of data to establish reliable baselines that account for diurnal and weekly patterns. For complex multi-signal pattern recognition — identifying the specific combination of correlated anomalies that has historically preceded server crashes — useful predictions typically emerge after two to four weeks of operation, and prediction accuracy continues to improve over the first three to six months as the AI model accumulates more training data and operational feedback. Organizations should plan for a phased activation: resource exhaustion predictions immediately, anomaly detection after two weeks, complex pattern recognition after four weeks, and automated remediation only after the operations team has validated prediction accuracy over a sustained period of production operation. Rushing to activate all capabilities simultaneously produces false alarms that erode trust in the system and delay the timeline to operational reliability.
Can AI monitoring predict every type of server failure?
No. AI monitoring can predict failures that develop gradually and that are preceded by detectable changes in server telemetry — memory leaks that progress over hours, disk space consumption that trends toward exhaustion, database connection pool saturation that builds as application traffic increases, hardware degradation that manifests as increasing error rates or latency before complete failure. It cannot predict failures that occur instantaneously and without precursor signals: a power supply that fails catastrophically with no prior voltage fluctuation, a network switch that dies mid-packet with no preceding error rate increase, a software bug that triggers an instant kernel panic on the first execution of a specific code path, or a DDoS attack that saturates network bandwidth in seconds. These "black swan" failures are unpredictable by any monitoring system, AI or traditional, because there is no precursive signal to detect. The value of AI monitoring is that it dramatically reduces the frequency of the predictable failures — which, in most hosting environments, represent 70% to 85% of total outages — while traditional reactive monitoring remains essential as the safety net for the unpredictable failures that AI cannot anticipate.
What is the return on investment for upgrading from traditional to AI-powered uptime monitoring?
The ROI calculation depends on the cost of downtime for the specific business, the frequency of predictable outages in the current hosting environment, and the reduction in outage frequency and duration that AI monitoring achieves. For a typical mid-range hosting deployment — an e-commerce site, a SaaS application, or a content platform generating $200 to $2,000 per hour in downtime-sensitive revenue — that experiences 3 to 5 hours of unplanned downtime per year, reducing downtime by 60% to 80% (the typical improvement range reported by organizations that have adopted AI predictive monitoring) saves $360 to $8,000 per year in direct revenue loss, not including the harder-to-quantify costs of customer churn, reputation damage, and operational disruption. Against an AI monitoring cost of $600 to $3,000 per year for a commercial platform monitoring 5 to 20 servers, the direct ROI is positive for most revenue-generating websites. For larger deployments with higher downtime costs, the ROI is proportionally stronger. The ROI equation becomes even more favorable when factoring in the operational efficiency gains — the reduction in after-hours incident response, the conversion of emergency remediation into planned maintenance, and the improvement in team morale and retention that comes from reducing the frequency of high-stress incident response — which are real but harder to quantify in dollar terms.
Does HostingCaptain include AI-powered uptime monitoring with its hosting plans?
Yes. HostingCaptain's managed hosting plans include AI-powered monitoring as an integrated feature of our hosting platform at no additional cost beyond the hosting plan itself. Our monitoring platform applies predictive analytics and anomaly detection to the telemetry from every server in our hosting infrastructure — shared hosting nodes, VPS instances, dedicated servers, and cloud deployments — with predictive models trained specifically on web hosting workload patterns. When our AI monitoring detects a predictive alert — a memory leak that projects exhaustion within hours, a disk consumption trend that will exhaust storage within days, a database performance pattern that matches known pre-degradation signatures — our support operations team is automatically notified and initiates investigation and remediation, often resolving the issue before the customer is aware of any degradation. This integrated monitoring-and-support model is a core differentiator of the HostingCaptain hosting experience: monitoring is not a separate service to be purchased and configured; it is embedded in the platform and operated by the same team that manages the hosting infrastructure. For customers evaluating their hosting options, our complete guide to VPS hosting provides details on the full range of HostingCaptain hosting plans and the features included at each tier.
Can AI monitoring reduce false alarms from my existing traditional monitoring setup?
Yes, and this is one of the most immediately valuable capabilities of AI monitoring. When AI monitoring is deployed alongside an existing traditional monitoring system, the AI system can function as an intelligent filter: the traditional system continues to generate threshold-based alerts, but those alerts are routed through the AI system's correlation engine, which suppresses alerts that correspond to known benign patterns (scheduled maintenance, expected traffic spikes, transient network hiccups that resolved before any user impact) and only escalates to the operations team the alerts that the AI system judges to represent genuine incidents. This "AI filter" deployment pattern allows organizations to maintain their existing monitoring investment and familiar alerting workflows while dramatically reducing the alert volume that reaches the operations team — typically by 60% to 80% — and eliminating the primary driver of alert fatigue. The AI system does not replace the traditional monitoring; it augments it with the contextual intelligence that the traditional system lacks, converting a firehose of threshold violations into a curated stream of actionable incidents.
What telemetry data does AI monitoring need access to, and are there privacy or security concerns?
AI monitoring requires access to server performance metrics — CPU, memory, disk I/O, network throughput, process-level resource consumption — and optionally to application-level metrics like request rates, error rates, and response latency. It does not require access to the content of web pages, the contents of databases, user personally identifiable information, or any data that would constitute a privacy or compliance risk under GDPR, HIPAA, PCI-DSS, or comparable regulatory frameworks. The monitoring agent transmits performance metrics — numerical time-series data — to the monitoring platform, not the data that the server is hosting or processing. For organizations with strict data sovereignty requirements, most commercial AI monitoring platforms offer regional data ingestion endpoints that ensure telemetry data is stored and processed within specified geographic boundaries, and the open-source deployment model allows organizations to keep all telemetry data entirely within their own infrastructure. Security best practices for monitoring agent deployment — running the agent under a dedicated service account with minimal privileges, encrypting telemetry data in transit, and restricting agent outbound network access to the monitoring platform's ingestion endpoints — are consistent with standard server hardening practices and do not introduce additional attack surface beyond what any monitoring solution requires.
How does AI monitoring handle sudden traffic spikes — will it false-alert during a legitimate viral event?
Sophisticated AI monitoring systems are designed to distinguish between anomalous traffic patterns that represent a genuine infrastructure risk and anomalous traffic patterns that represent a legitimate surge in demand. The distinction is made through multi-signal correlation: a sudden traffic spike that is accompanied by corresponding increases in web server request throughput, database query throughput, and bandwidth utilization — all within the capacity limits of the infrastructure — is recognized as a demand surge rather than an infrastructure failure. The AI system may still generate an informational notification ("traffic to server X is 400% above baseline — verify that infrastructure capacity is sufficient"), but it will not generate a critical alert unless the traffic spike is accompanied by degradation signals — rising error rates, increasing response latency, resource pool exhaustion — that indicate the infrastructure is struggling under the load. This multi-signal approach dramatically reduces the false alarms that traditional threshold-based monitoring generates during viral events, where every metric simultaneously exceeds its fixed threshold despite the server operating correctly and serving all requests successfully. Organizations concerned about viral-traffic false alarms can further tune their AI monitoring by providing feedback during initial viral events — marking the event as "expected, no incident" — to accelerate the model's learning about the difference between a demand surge and an infrastructure failure.
Is AI uptime monitoring worth it for small websites with low traffic?
For small websites — personal blogs, portfolio sites, local business brochure sites with fewer than 5,000 monthly visitors — the financial case for AI monitoring is weaker than for revenue-generating websites, because the cost of downtime is lower and the traditional monitoring alternatives are inexpensive and adequate for the use case. A $10-per-month UptimeRobot or HetrixTools subscription with 1-minute interval monitoring and SMS alerts provides reasonable coverage for a small website where an hour of downtime costs little more than mild inconvenience. However, there are two scenarios where AI monitoring becomes worthwhile even for small websites. First, if the website is hosted on a shared hosting plan where resource contention with neighboring tenants can cause unpredictable performance degradation — AI monitoring can detect the patterns of shared hosting resource starvation (I/O wait spikes, CPU steal time increases) that traditional ping monitoring would miss and that often precede a site becoming completely unresponsive. Second, if the website owner lacks the technical skills to diagnose and respond to server issues — a small business owner who would not know how to interpret a CPU utilization alert but can benefit from an AI system that says "your site is likely to become slow or unavailable in the next 2 hours due to high server load — contact your hosting support team." In this second scenario, AI monitoring substitutes for the technical expertise that a larger organization would have on staff. HostingCaptain's integrated AI monitoring, included with our shared hosting plans, makes predictive monitoring accessible to small website owners without the separate subscription cost or technical configuration burden that standalone AI monitoring platforms require.
Arjun Mehta is a cloud infrastructure consultant specializing in bare-metal architectures, network routing, and high-traffic database clustering.
Frequently Asked Questions
This guide covers the practical decision points — pricing, performance, and when it makes sense for your situation — based on current 2026 data.
Pricing varies by provider and plan tier; see the cost breakdown section above for current ranges and what's actually included at each price point.
Look closely at uptime guarantees, renewal pricing (not just the first-year discount), and how responsive support actually is — all covered in detail in this article.
Hosting Captain has been exceptional for my e-commerce store in Pune. The NVMe SSD speed is
noticeable, and their support team responds within minutes. Highly recommended for any
Indian business!
Ryan John, Pune
Great Value for Money
Switched from a US-based host to Hosting Captain and my website loads 3x faster for Indian
visitors. The free SSL and cPanel are great, and the pricing is unbeatable. Very satisfied
customer!
Priya Mehta, Mumbai
Reliable VPS Hosting
I've been using their VPS plan for 2 years now. 99.9% uptime is not just a claim — it's
reality. My client projects run without interruption. The KVM virtualization gives me full
control I need.
Amit Kumar, Bangalore
Excellent 24/7 Support
The support team helped me migrate my entire WordPress site at 2 AM without any downtime.
This level of service is rare in Indian hosting. Worth every rupee!
Sunita Patel, Ahmedabad
Perfect for Startups
As a startup, budget matters. Hosting Captain's Business plan covers everything we need —
multiple websites, free SSL, daily backups — at a fraction of what international hosts
charge.
Vikram Singh, Delhi
Professional Dedicated Server
Our high-traffic news portal needed a dedicated server. Hosting Captain's DS Business plan
handles 100K+ daily visitors effortlessly. Their team provisioned everything within 4 hours!
Meena Krishnaswamy, Chennai
Trusted Technologies & Partners
Start Your Website with Hosting Captain
From personal blogs to enterprise solutions, we've got you covered!